Overview
Effortlessly summarise, analyse and present data from DevMan directly to Excel for comprehensive reporting.
Topics
")
•Generate and save re-usable reports. •View interactive dashboards for enhanced data analysis. •Simply refresh data to reflect the latest information. |
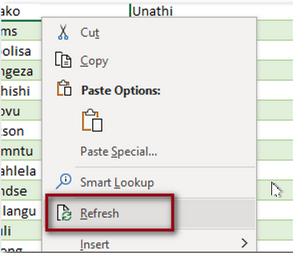
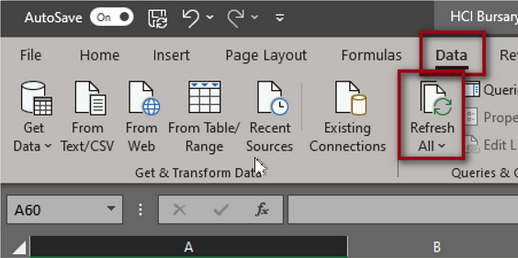
•Save a copy of the report on your network / PC. •When opening the report, you may be prompted to enable content and make it a trusted document – accept these prompts. •Dashboard – this sheet reflects high level statistics of applications based on the source data. •Source data – the other sheets list details for the applications. These sheets draw the information from DevMan and will show with alternating green and white rows. •To refresh the report: oGo into each source data spreadsheet, right click on the page and select ‘Refresh’. This will pull through any new data from DevMan. oGo to the Dashboard sheet, select the Excel Data tab, then Refresh all to update the pivot tables and graphs. oIf you get an error message referring to pivot tables overlapping, add in additional rows between pivot tables.
|
The steps to create an EIR are as follows: •Create a saved search using search advanced. •Select Export or Statistics. •Create a saved Export or Statistics selection, and then select Publish report. •Save the published report, and then select Extract > To link. Copy the link. •In a new Excel spreadsheet, select the Data tab. Then select the From Web button, and paste this as a Basic URL. •Select your saved report you want to import, and then select Transform data. (For Excel help follow the link provided in the pop-up)
The following tutorial demonstrates how to create an Excel integrated report from a published report on DevMan.
Create a published report and link to an Excel intergrated report |
In the first phase you will need to create an .iqy file. This is just the query with the link to DevMan. You can create this by doing the following: •After generating your published reports, in the list view of the report, click Extract > To link. •Copy the link. •Open Word or a Text editor. •Paste the DevMan published reports link into the document. •Click Save as and name your file. (Save to a place where you will be able to locate it) •On the document file itself, double-click the name so that you highlight it – as if you were wanting to change the name. •Delete the file extension only, and replace it with .iqy •Example: If you used Word to create the file, it will say “exampledata.docx”. Change that to “exampledata.iqy”.
|